Local Positioning System

Lane-level vehicle positioning that keeps running where GNSS fails: road tunnels, underground carparks and urban canyons. No roadside infrastructure.

The gap in the road network

Brisbane alone routes traffic through three major road tunnels: the AirportLink M7, Clem7 and Legacy Way. Vehicles do not stop needing a position once they enter one. Transit continuity, freight visibility, emergency response and any level of driving automation all depend on knowing where the vehicle is. GNSS needs a clear view of the sky, so it degrades in urban canyons and disappears entirely underground.

The established fix is to fit out the tunnel itself. Bluetooth beacons are specified at 20 m intervals, roughly 50 units per kilometre. Hardware alone runs US$900 to US$1,000 per kilometre before installation or traffic management, and because the batteries can be neither recharged nor replaced, the entire population has to be swapped out every four to six years inside a live tunnel. That is a permanent obligation on the road operator, renewed every few years, for every bore.

LPS moves the hardware onto the vehicle instead, and leaves the tunnel untouched.
What is LPS?

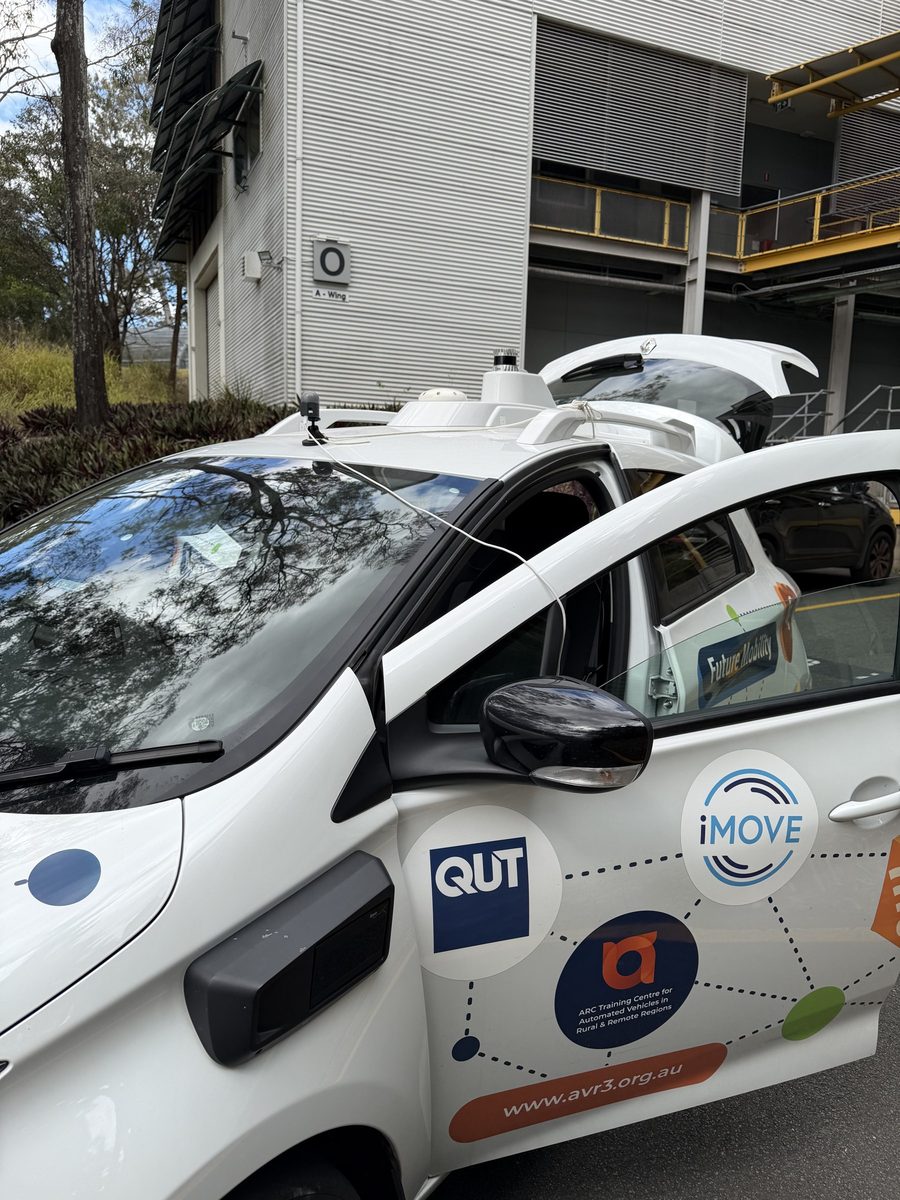
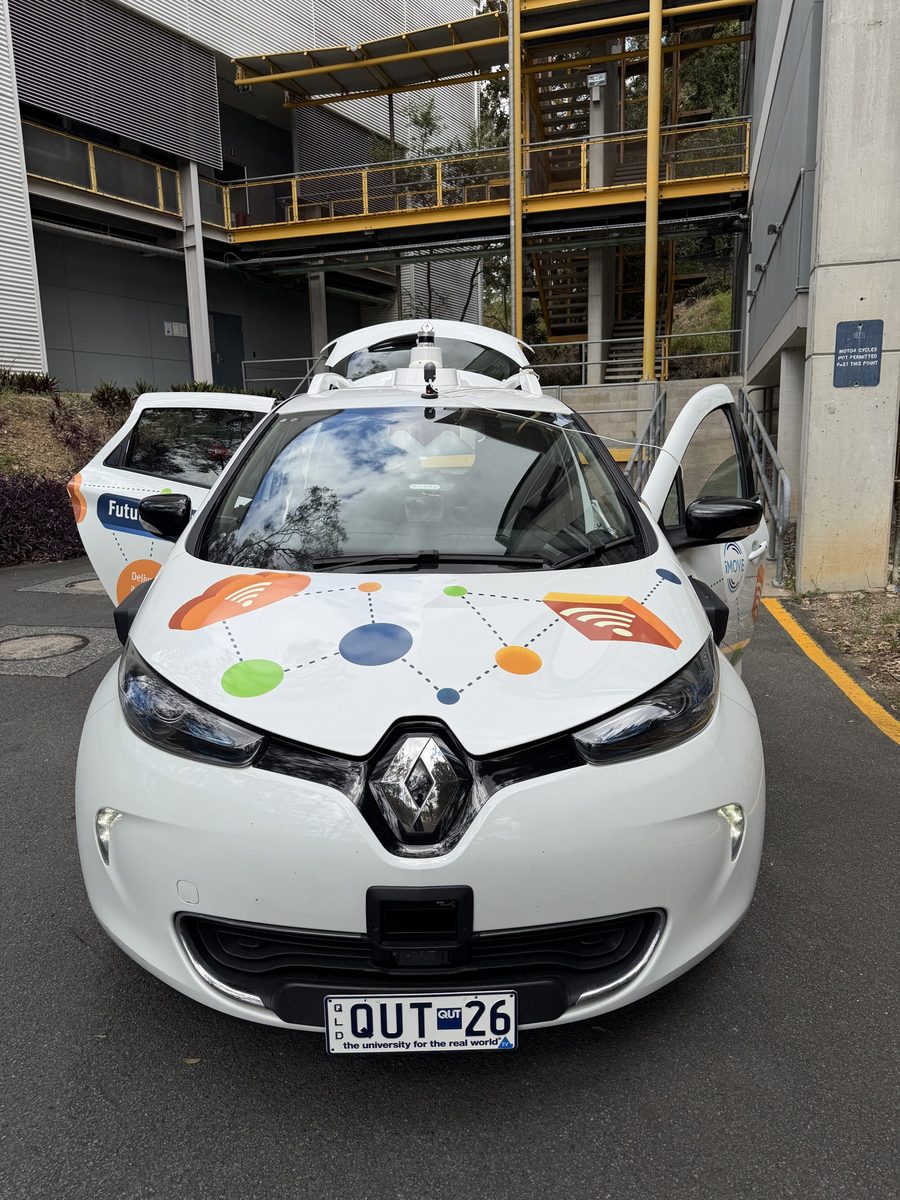
ZOE, QUT's instrumented research vehicle, with the LPS sensor circled in red on the roof above the windscreen

ZOE, an instrumented research vehicle

The LPS sensor, circled in red, on ZOE's roof beside the vehicle's own sensors

LPS on the roof, beside the vehicle's own sensors

LPS is a small, low-resolution sensor that estimates position by matching what it sees against a compact reference map of the corridor. The map is built by driving the route once; every vehicle afterwards localises against it on-device. Nothing is installed in the tunnel, on the roadside or in the road surface, and the same unit works on any mapped corridor rather than only the ones that have been fitted out.

On ZOE, the research vehicle used for the tunnel accuracy trials, the sensor sits on a magnetic roof mount clear of the car's own cameras, LiDAR and inertial navigation, which provide the independent reference it is scored against.

Low power, low profile, low data

Sensor Data Power Privacy Profile
LPS ~1.5 KB per frame Low High
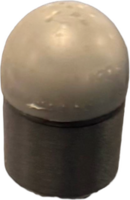
LPS initial prototype
Initial prototype
Dimension: 62 × 45 × 47 mm
Weight: ~70 grams
RGB camera ~4 MB per frame Low–medium Low
GoPro Hero 11
GoPro Hero 11
Dimension: 51 × 72 × 33 mm
Weight: ~159 grams
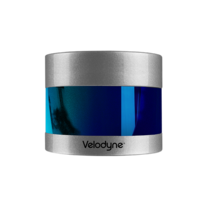
LiDAR ~0.9–8 MB per scan High Medium
Velodyne Puck
Velodyne Puck
Dimension: 103 × 86.3 × 88.9 mm
Weight: ~830 grams

Numbers are representative and depend on the actual sensor resolution, frame rate and configuration.

Results

Accuracy inside the tunnel: AirportLink M7

GPS cannot check a position underground, so we measured it on an instrumented research vehicle whose inertial navigation is logged through the tunnel. Two trials, each driving the tunnel northbound and southbound, covered 9.5 km at about 70 km/h. Nothing was installed in the tunnel.

One map for both trials. The reference map was built once, from two passes, one per lane. One trial was driven the same day as the mapping run, the other two days apart from it. Both were positioned against that same map with the same settings, with nothing re-surveyed or re-tuned in between.

Map recorded the same day. 4.7 km of tunnel, 96.6% of estimates within 15 m, median error 2.3 m.
Map recorded two days apart. 4.8 km of tunnel, 88.6% of estimates within 15 m, median error 3.3 m.

Both trials combined

2.6 mMedian position error
92.4%Of estimates within 15 m
0.6 mMedian error across the road
94.3%Within one lane width across the road

9.5 km of tunnel · 96.0% of estimates within 25 m · 95th-percentile error 21.2 m · reference mapped once · no infrastructure installed

Errors are relative to the vehicle's inertial navigation, the only reference measured inside the tunnel. The settings were fixed in advance rather than tuned to this run. Most of the error is along the road; across the road the estimate rarely leaves the true lane.


Lane-level positioning inside tunnels

Knowing how far along the tunnel a vehicle is answers only half the question. Which lane it is in drives exit-ramp guidance, lane-specific traffic monitoring, incident response and automated driving decisions. LPS provides accurate lane-level positioning inside tunnels.

One reference trajectory per lane: blue for the left lane, orange for the right. The live estimate matches one of them from the sensor signature alone.

99.6% balanced lane accuracy (644 of 647 frames) across 1.15 km · 6 of 6 lane changes detected · the only misses fall within 1 s of a lane change


Urban driving: Kelvin Grove, Brisbane

A 3.8 km two-way urban route. GPS is available the whole way, so this run is the yardstick for reading the GNSS-denied results above.

Median error 2.6 m · 94.5% of estimates within 15 m · 99.9% within 25 m · largest error 29 m

These errors are measured against smartphone GPS, which is accurate to about 8 m, rather than a surveyed reference, so they include the GPS receiver's own error.

Nothing identifiable leaves the vehicle

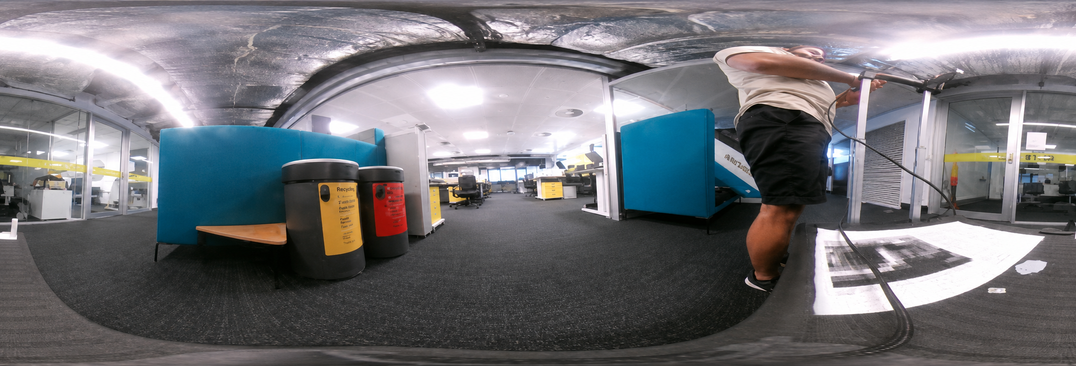
Example image from a 360-degree RGB camera showing an identifiable indoor scene

What a 360° RGB camera captures

Coarse grayscale position signature captured by the LPS sensor

What the LPS sensor captures

No faces, number plates or identifiable detail exist in the captured data. Privacy is inherent to the sensor, not applied by post-processing, which removes a class of data-governance and public-acceptance problems before it arises, whether the fleet is commercial, public transport or council-operated.

What it costs to cover a corridor

Beacons put the cost in the tunnel, once per tunnel, and again every replacement cycle. LPS puts it on the vehicle, where it scales with the fleet instead of the network.

In-tunnel beacons LPS
In-tunnel hardware ~50 units per kilometre Nothing
Cost per kilometre US$900–1,000, before installation None
Setup per corridor Installation with traffic management One survey drive
Ongoing Full replacement every 4–6 years Re-survey if the corridor changes
Scales with Kilometres of tunnel fitted out Vehicles equipped

Beacon figures are Waze's published specifications for its Beacons programme; see the FAQ for sources.

Frequently asked questions

How does this compare with installing beacons in the tunnel?

The established alternative is to fit out the tunnel itself with Bluetooth beacons, of which Waze Beacons are the most widely deployed example. Waze specifies them at 20 m intervals (15 m minimum, 40 m maximum), wall-mounted 4 to 5 m above the roadway with at least 25 cm clearance from any metal. That is roughly 50 units per kilometre at the optimal spacing; a published Australian deployment across Transurban tunnels used more than 930 beacons to cover 18 km.

Waze publishes the hardware cost as US$900 to US$1,000 per kilometre, bought from the manufacturer. That figure covers the units alone, not installation, traffic management or tunnel access. The beacons are also consumable rather than permanent: battery life is 4 to 6 years, and because the batteries are neither rechargeable nor replaceable, a dead unit has to be replaced in full, so the whole population falls due for replacement roughly every five years, inside a live traffic tunnel.

LPS moves that hardware onto the vehicle instead. Nothing is mounted in the tunnel, nothing underground needs power or periodic replacement, and the same sensor works in any corridor that has been mapped rather than only those that have been fitted out.

How do you know it works in a tunnel if there is no GPS to check against?

With an instrumented vehicle. Its inertial navigation is logged all the way through the tunnel, so every LPS estimate can be scored against an independent position, not just at the portals. Across 9.5 km of the AirportLink M7 the median error was 2.6 m and 92.4% of estimates were within 15 m. On ordinary vehicles, GPS at each portal still brackets every transit with a known position at both ends.

How often does the reference map need re-surveying?

The reference is built from one drive-through and only needs updating when the corridor changes substantially. Tunnels change slowly. Because a re-survey is a single pass with the same sensor and the map is megabytes in size, refreshing a route is a routine operation rather than a mapping campaign.

Does it work at night or under changing lighting?

Tunnels are lit artificially and remain stable around the clock, which is where LPS has been demonstrated. Large lighting shifts between mapping and localisation can degrade matching; evaluating day–night operation on open roads is ongoing work.

What are the latency and update rate?

The current prototype produces position estimates at ~10 Hz.

What compute does it need?

Signatures are ~1.5 KB per frame and reference maps are megabytes per route, so matching runs on low-power edge hardware. No GPU and no cloud connection are required at runtime.

What does it output, and how does it integrate?

LPS outputs a position stream in the reference map's coordinate frame (geo-tagged if the survey run was), which can be consumed by a vehicle system, fleet platform or application in the same way as a GNSS feed. Integration interfaces are part of current pilot work.

What happens in visually repetitive sections?

Repetition is the hard problem in tunnels: a wall 500 m in looks like a wall 3 km in. LPS resolves this by matching sequences of signatures and filtering with vehicle motion rather than deciding from any single frame. The tunnel and lane-level results above were produced under exactly these conditions.

Beyond the road network

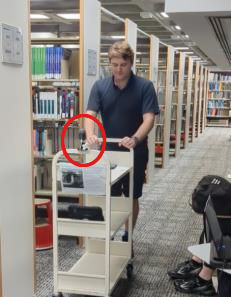
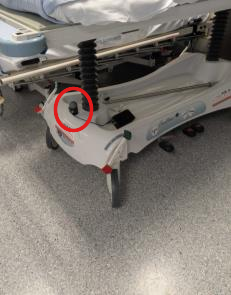
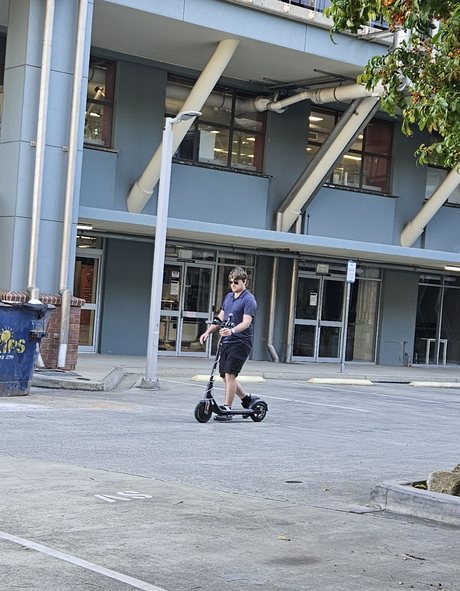
The same sensor and the same method work anywhere GNSS does not reach. Alongside the transport work, LPS has been demonstrated tracking mobile assets indoors: a library trolley moved across five levels and left in a storeroom, and hospital equipment that has to be found rather than searched for. Mounted on an electric scooter's handlebars, it has positioned the scooter through a car park and across an overpass.

LPS sensor mounted on a library trolley

Library trolleys

LPS sensor mounted on a hospital bed

Hospital beds

The instrumented electric scooter, with the LPS sensor on its handlebars, in the O Block car park

E-scooters

E-scooter on campus paths

The scooter ridden along the paths between M Block and O Block at QUT Gardens Point, under trees and beside buildings. The map shows where LPS placed the scooter, live, next to a phone video of the same ride.

Median error 0.8 m · 87% of estimates within 2 m · 99.7% within 3 m · shown at 3× speed

In the parking bay, or blocking the footpath?

On Alice Street, beside the City Botanic Gardens, the footpath is split lengthwise: the strip next to the kerb is a marked e-scooter parking bay, and the side by the garden fence is for people walking. A scooter left on the garden side blocks the path. The two sides are only a couple of metres apart, under trees where phone GPS is far less precise than that. This trial ride weaves between the sides; the video shows which side LPS places the scooter on, from LPS alone.

Median error 0.9 m · 94% of estimates within 2 m · 100% within 3 m · shown at 4× speed

An early trial. The reference is the phone's odometry track, with the recordings aligned to each other and the straight ride taken as parallel to the road.

Talk to us about a pilot

A pilot is deliberately small: pick a corridor that matters to you, we survey it in a single pass, mount a sensor on one of your vehicles, and you evaluate the output against whatever reference you already trust. That is enough to tell whether this belongs in your stack.

Project Leader: Professor Michael Milford, FTSE (michael.milford@qut.edu.au)

Supported by

Australian Government - Australian Research Council iMOVE CRC QUT Australia's Economic Accelerator